Optimizing VNA Measurement Speed
April 19, 2018Background
Users of Vector Network Analyzers (VNAs) often need to estimate and strive to optimize their instrument’s measurement speed. Many RF Engineers are interested in the tradeoffs between speed, accuracy and resolution in VNA measurements, especially those striving to achieve optimal automation of the instrument integrated in a larger measurement system or production environment. This application note details the determining factors for measurement cycle time in Copper Mountain Technologies VNAs.
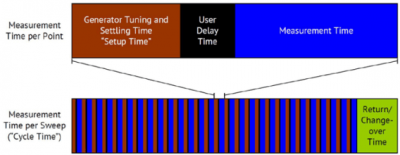
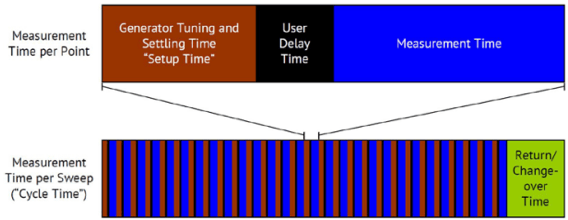
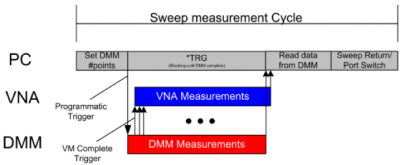
Generally speaking, the measurement cycle for any VNA consists of three major components: the per-point tuning and settling time of the generator, the per point measurement time, and a per-sweep time needed to process and transfer results, switch the generator between output ports, and return the generator to the start frequency. An additional, user-programmable delay between points is available in CMT instruments, which may be useful for integration with external equipment or DUTs with settling times of their own.
As will be seen, some of the delay components are effectively fixed, while others depend upon the measurement parameters and thus may be optimized by the user.
Generator Tuning and Settling Time
The first component of Measurement Time per Point, the Setup Time, is determined by hardware and software limitations for generator retune and settling. This time includes latencies associated with command and control internal to the VNA as well as dependencies arising from the generator architecture such as settling times of an associated phase-locked loop (PLL) or voltage-controlled oscillator (VCO) necessary to achieve a stable output signal frequency and power level for the next measurement point.
Setup Time dependence on frequency and step size can quickly become difficult to model and therefore is not fully characterized in a VNA’s performance specification. Instead, typical cycle measurement times are provided for the VNA for a particular start and stop frequency and number of points. Usually at least one such frequency range will be the full span of the instrument, which provides something of an upper bound on the setup time, as the time is generally lower for smaller frequency spans. The Setup Time cannot be optimized by the user in general since it is constant for the hardware of a given VNA. However, the Setup Time does often vary depending up on frequency and interfrequency step size, so to the extent the stimulus frequency range or point density is flexible in your measurements, this can perhaps be exploited to optimize measurement time.
Measurement Time
The second component of the Measurement Time per Point, the Measurement Time, includes a variable aperture time necessary for measurement that is based on the settling time for the IF filter. Narrower IF filters require more time to ring out, or settle. The measurement time in seconds is generally equivalent to an IF Bandwidth (IFBW) coefficient divided by the user selectable IFBW in Hz. Copper Mountain Technologies Planar, S, TR, and R-series VNAs have an IFBW coefficient of 1.18 and a maximum IFBW of 30 kHz. Therefore, the minimum per-point Measurement Time is 39 µsec.
In reality, the actual Measurement Time of the instrument is slightly longer than the IFBW settling time because it also incorporates fixed delays associated with digitization and internal data transfers. These fixed delays are negligible compared with the IFBW delay and to the extent they are significant, can be considered as part of the Setup Time.
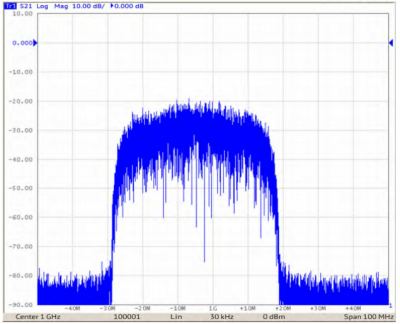
Naturally there is a tradeoff between IFBW/ Measurement Time and Dynamic Range. The Figure below illustrates the effects of using a wider IFBW on Settling time and Dynamic Range for the Planar 804/1 VNA, a 2-port instrument which measures from 100 kHz to 8.0 GHz. The IFBW can range from 1 Hz to 30 kHz and the dynamic range at 1 Hz is 145 dB.
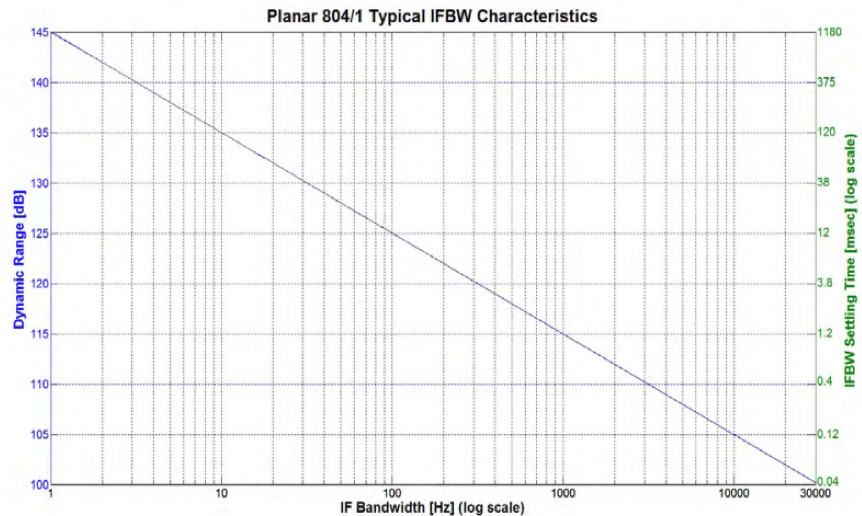
Since the IFBW is the dominant variable component of the per-point measurement speed of the VNA, one should pay particular attention to its selection when trying to optimize measurement speed. Widening the IFBW will decrease measurement time per point, but also decrease the dynamic range of your measurement. For every doubling of the IF Bandwidth, the dynamic range decreases by 3 dB, so you lose 10 dB of dynamic range per decade. The IFBW coefficient is 1.18, so selection of an IFBW between 1 Hz and 30 kHz corresponds to a settling time between 1.18 sec and 39.3 µsec.
If the dynamic range of an instrument is specified to be 145 dB at 1 Hz IFBW, then at 30 kHz IFBW, the dynamic range will be 100 dB according to:

Return Time
Beyond the per-point delays, the full measurement cycle for the instrument also includes fixed and variable delay components. The fixed components include a 10 msec port switchover time to change the generator between ports, an approximately 100 µsec time for returning the generator to its start frequency, and a small USB latency between sweeps.
While the port switching time is a fixed delay, users can specify the number of sweeps and which parameters are measured, and by so doing can perhaps minimize the number of port changeovers. When a port changeover is not required between sweeps, the delay is much smaller and may be termed “Return Time”. In Copper Mountain Technologies VNAs the Return Time is the sum of sweep frequency return time and USB latency, and is typically several milliseconds, though this time will vary based on your PC, the USB controller, and how many USB devices are connected to the USB controller.
The final variable component for the full measurement cycle is the number of points incorporated in each sweep. As you increase the number of points, the frequency resolution of your measurement increases, but the duration of the measurement cycle increases as well. For large IF bandwidths and number of points below ~401, the fixed per sweep delays dominate the cycle time. As the number of points increases, or narrower IF bandwidths are employed, per-point delays and number of points contribute substantially to the cycle time. In these cases, reducing the number of points or increasing IF bandwidth may meaningfully improve total cycle times.
Estimating Total Cycle Time
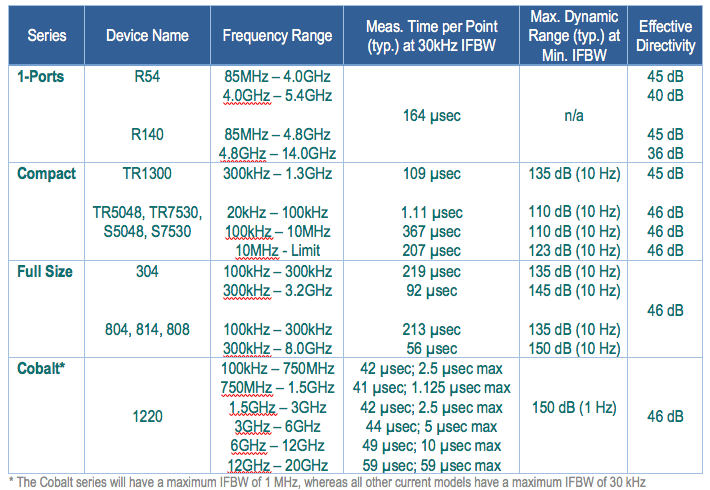
Total cycle times can be estimated based on the data for each instrument shown in the table below. The stated minimum measurement time per point is based on an IF bandwidth of 30 kHz and thus includes a 39.3 µsec of IF filter settling time per point; this portion of the time per point increases proportionally to the selected IFBW as described earlier. Similarly, dynamic range is shown with each instrument’s corresponding minimum IFBW and will decrease 10 dB/decade at wider bandwidths.
Alternatively, a measurement time estimation tool is available as an Excel file at www.coppermountaintech.com or by contacting [email protected]. In this calculator tool, a product can be selected, the relevant measurement parameters entered, and the measurement cycle time estimated directly.
Summary
The total measurement cycle time for a VNA consists of fixed delays as well as a number of parameters which are under the user’s control. Accurate estimation of the cycle time for a given set of stimulus and measurement parameters is straightforward once the delays involved are well-understood. A cycle time estimation tool is available for download at www.coppermountaintech.com to simplify the estimation process.


Comments (18)