
Copper Mountain Technologies Planar 304/1 Network Analyzer Initial Testing Report
March 7, 2013By: Elliot Riley
1 Introduction
This test report analyzes the Copper Mountain Technologies Planar 304/1 Network Analyzer. The analyzer has a frequency range of 0.3 MHz – 3.2 GHz. Much of this report compares test results from the Copper Mountain network analyzer to an Agilent E8364B PNA Network Analyzer that has a frequency range of 10 MHz – 50 GHz. The Agilent analyzer was calibrated in the fall of 2012 and has brand new cables that interface devices to the test ports. It is expected that the Agilent analyzer gives very accurate results and can be trusted as a reliable benchmark. It should be noted that all tests performed here were done so in an informal nature. Both analyzers were not located in the same exact location and the same cables were not used at all times. Small differences that appear in the data may be attributed to these testing differences. Any calculations or presentation of data was also done to look at estimated results. All of the testing was aimed at getting good solid estimates not high quality measurements accurate to a tenth of a dB. More rigorous analysis can be performed in the future if desired. However, for now these initial experiments gave satisfactory results.
2 Magnetic Green Box Antenna S11 Measurements
The first test performed on the Copper Mountain Planar 3041/1 Network Analyzer was to measure the S11 response of an antenna and compare it to the Agilent E8364B Network Analyzer. The antenna used was the green magnetic box antenna. The simple test parameters and results are discussed below.
First the analyzer was calibrated using an the Agilent 85056A 2.4 mm calibration kit. The Copper Mountain network analyzer utilizes female N type connectors on both ports. A high quality male N to male N cable manufactured by Storm was used to interface to the analyzer. A female N to male SMA adapter was used to interface to the AUT (antenna under test). Then to use the calibration kit a female SMA to female 2.4 mm adapter was used. It should be noted that the Copper Mountain software did not have this calibration kit preloaded. So a similar Agilent kit (8505D) was selected in the software and used. In the future, the parameters for the 85056A calibration kit can be manually entered into the Copper Mountain software if so desired. The calibration kit parameters are available online from Agilent. The Agilent E8364B Network Analyzer was calibrated using the Agilent N4693-60001 E Cal module.
Table 1 shows all of the settings used on both analyzers. The settings were kept consistent so that good comparisons could be made between the measured data. No smoothing or averaging was used on either piece of equipment.
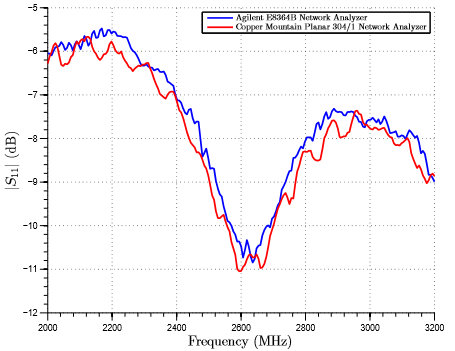
Fig. 1 shows the data taken from both analyzers. The data seems to track very nicely except in the upper half of the band. At the higher frequencies the imprecise calibration of the Copper Mountain analyzer could possibly be the cause. Also, the cables and adapters used with the Copper Mountain analyzer may not be in perfect condition. For all intensive purposes, both analyzers present very similar data.
The upper portion of the band definitely does not seem to match perfectly. However, it should be noted this antenna was not designed to work much above 500 MHz. Also, at higher frequencies it is very important to be careful with anything that may be in the test environment of the antenna. These tests were not done is the same location. Quite possibly the radiation affects and surrounding structures could have lead to these differences.
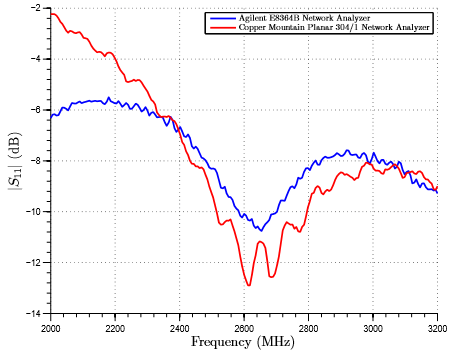
To check if the calibration was an issue at all, the Copper Mountain analyzer was calibrated using an Agilent 85033D 3.5 mm calibration kit. This kit was available to be selected in the Copper Mountain software. With this calibration, the box antenna was measured again. This data was then compared to the measured Agilent data again. It can be seen in Fig. 2 that the results are nearly the same as with the previous calibration kit. No noticeable difference is detected.
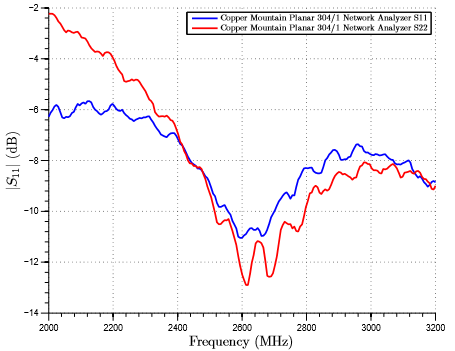
Just to be thorough, the Agilent analyzer was calibrated again using the E Cal module and the box antenna was again measured. This data was then compared to the Copper Mountain analyzer data with the 3.5 mm calibration. This data can be seen in Fig. 3. This data seems to match up better. It is not really known why in the upper portion of the band the data matches more closely this time than before.
In conclusion, it is not that important to make the higher ends of the frequency band match up perfectly on both pieces of equipment for this antenna. This antenna is not designed to work at those frequencies anyway. The differences can probably be attributed to the environments surrounding the antenna. Both pieces of equipment report the same exact data for the band of interest for this antenna.


3 2 Piece Egg Shaped Antenna S11 Measurements
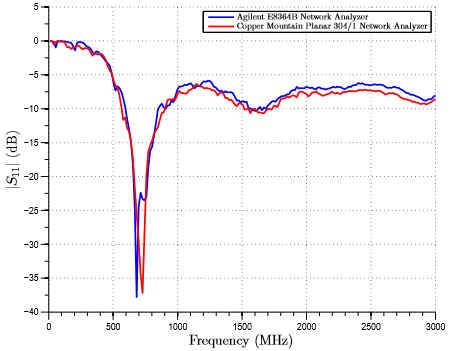
The next antenna tested was the antenna that approximated a half of an egg shape above a ground plane. The Copper Mountain analyzer was calibrated using the Agilent 85033D calibration kit while the Agilent analyzer was calibrated using the E Cal module. Table 2 shows the settings on both analyzers were the same. Fig. 4 shows the plotted data. This data seems to match up very well. This antenna was very sensitive to whatever was in its surrounding environment. Just being close enough to the system to control the mouse to save data affected the plot. Again, for all intensive purposes both analyzers show similar data.

4 Time Domain Measurements
4.1 ETS Lindgren Horn Antennas
Two horn antennas were used in this testing. First, two horn antennas were connected to port 1 and port 2. All parameters used for both analyzers are listed in Table 3. The Copper Mountain analyzer was calibrated using the Agilent 85033D calibration kit and the Agilent analyzer was calibrated using the E Cal module. Fig. 5, Fig. 6, and Fig. 7 show response data and comparisons for the antennas. The data is very similar as expected from both analyzers. The difference can most likely be attributed to different surrounding environments as both analyzers are not in the same exact location.
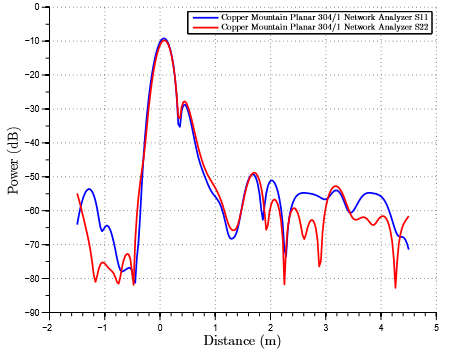
With the responses of the antennas checked, time domain experiments were performed. The parameters used for the time domain experiments are shown in Table 4. A large metal plate was positioned roughly 1.22 m (4 ft) from both antennas connected to the Copper Mountain analyzer. The time domain analysis converts the frequency domain information of S parameters into a time series to show at what time signals are received back at the analyzer. Peaks in the time series correspond to large impedance differences. Using this round trip travel time and the speed of light, the distance to the metal plate can be estimated.
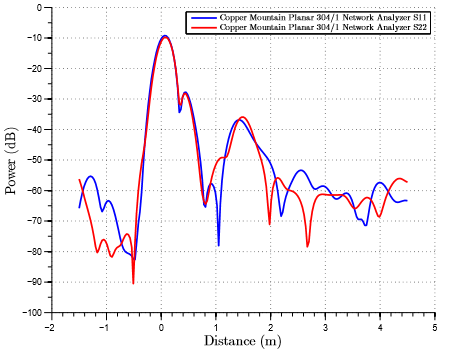
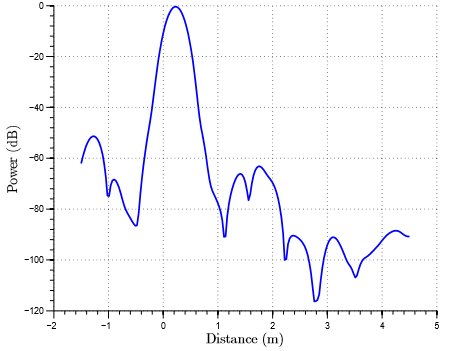
S11 and S22 measurements were investigated in the time domain. These measurements are similar to a monostatic radar setup. A signal is sent out of the antenna on a port then received after reflection on the same port. Using this information a range profile plot was generated for each antenna on each port using Matlab. This can be seen in Fig. 8. Notice on the plot the first two peaks to the right of 0 m. These peaks are due to the antenna itself. The next large peak at roughly 1.5 m is the large metal plate. Both ports report nearly the same distance to the metal plate. Again, none of these measurements or experiments were performed rigorously. They are a ballpark distance to the large piece of metal.
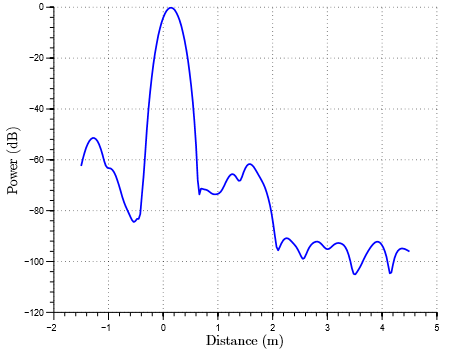
Next an S21 measurement was used to approximate a bistatic radar setup. A signal was sent on the port 1 horn antenna and then received on the port 2 antenna. Again, using this information a range profile plot could be generated using Matlab. This plot is shown in Fig. 9. The first peak to the right of 0 m is again the antenna itself. The next large peak around 1.5 m is the large metal plate. This result agrees with the S11 and S22 measurements.
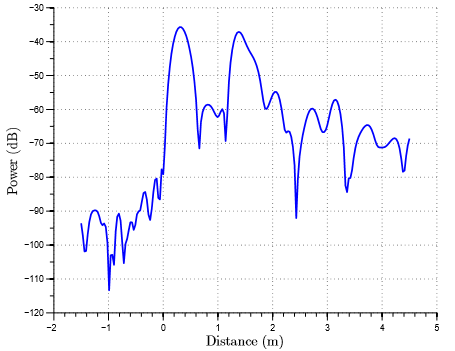
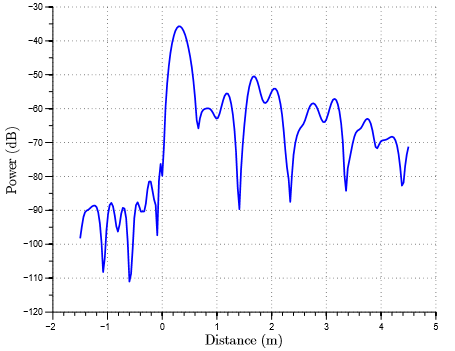
The next logical experiment was to use the time gating feature on the Copper Mountain analyzer to remove the reflections present from the large metal plate. This feature was used with the parameters shown in Table 5. The gating was performed on the S11, S22, and S21 time domain data. The results can be seen in Fig. 10 and Fig. 11. The time gating nicely reduces the reflection from the large metal plate in all sets of data by roughly 15 dBm.


4.2 3 Cables of Different Length
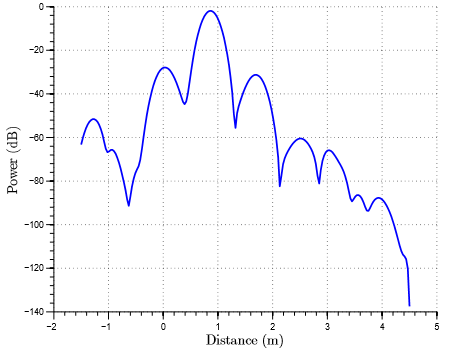
The time domain function was then tested on 3 SMA cables of length roughly 0.6 m (2 ft), 0.15 m (6 inches), and 0.10 m (4 inches). The analyzer settings can be seen in Table 6 and the time domain settings can be seen in Table 7. The Copper Mountain analyzer was calibrated using the Agilent 85033D calibration kit. Using the same conversion process the time domain information was manipulated in Matlab to produce output plots showing the approximate length of the cables. These can be seen in Fig. 12, Fig. 13, and Fig. 14. Again, these results and calculations are estimates. The speed of light for free space was used in these calculations not the true propagation velocity in the cables being tested. These results could be more accurate if the appropriate propagation velocities were obtained for the cables tested. However, for now these experiments show that the length of the cables under test are approximated very well by this process.


5 Filter Measurements
From this point on it must be noted that a slight inaccuracy was discovered on the Agilent analyzer. The cable connected to port 1 showed some sign of not operating perfectly. When the cable was moved to a new position the response of an S11 measurement would change and then require time to settle back to the proper values. This is not of great concern because all of these measurements are just ballpark comparisons.
All filter measurements utilized the parameters shown in Table 8. The Copper Mountain analyzer was calibrated using the Agilent 85033D calibration kit while the Agilent analyzer was calibrated using the E Cal module. The Agilent analyzer could not go below 10 MHz. The lower calibration on the Copper Mountain analyzer was just done to show that the Copper Mountain Analyzer could go lower than the Agilent analyzer.

5.1 Bandpass Filter 1
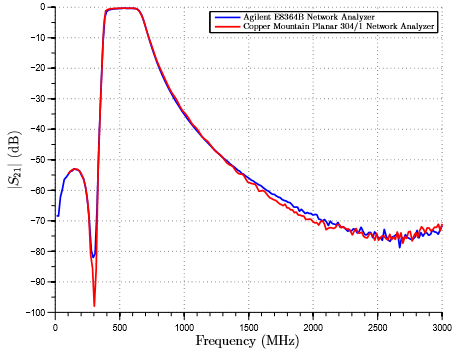
The first filter measured on both analyzers was a bandpass filter which passed frequencies of
roughly 385 MHz to 675 MHz. The results of this S21 measurement can be seen in Fig. 15.
The data from both analyzers matches up nearly perfectly.
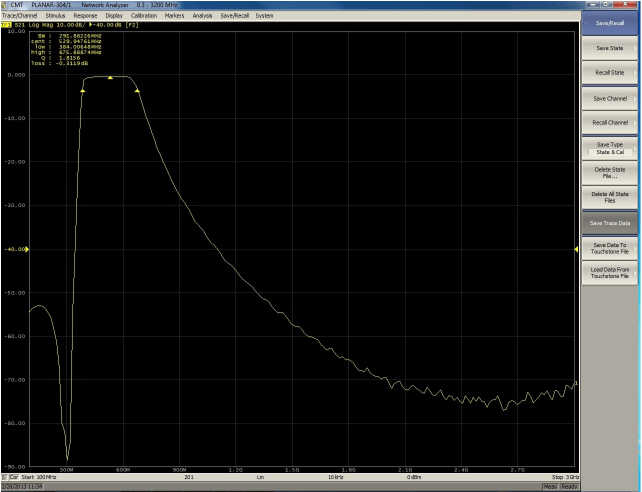
Another feature explored was the bandwidth search option. This option searched for the
max and 3 dB down points in the bandpass response to display some characteristics of the
filter. This feature is very convenient. The Agilent analyzer had a similar function. A screen
shot of the display provided by this function can be seen in Fig. 16. The Copper Mountain
analyzer provided other functions that the Agilent analyzer did not provide. These other
functions gave RF filter statistics and even a flatness value in the pass band.
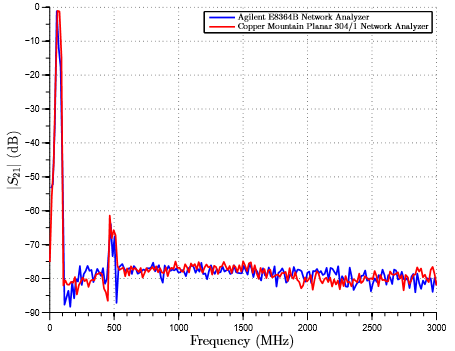
5.2 Bandpass Filter 2
The next filter measured was also a bandpass filter. It passed frequencies from roughly 58
MHz to 80 MHz. The data for this S21 measurement can be seen in Fig. 17. Again, the data matches up nearly perfectly for the two analyzers.
5.3 Notch Filter
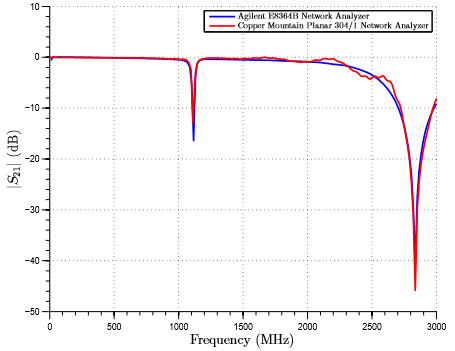
Next a notch filter was measured. The data for this S21 measurement can be seen in Fig. 18.
Again nearly perfect agreement is seen from both of the analyzers measurements.
6 Amplifier Measurements
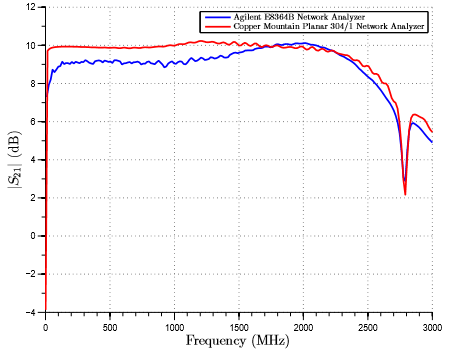
The final measurements were made on a 10 dB amplifier. The Copper Mountain analyzer was
calibrated using the Agilent 85033D calibration kit while the Agilent analyzer was calibrated
using the E Cal module. Table 9 shows the settings used on both analyzers. The results of
this S21 measurement can be seen in Fig. 19. A slight difference can be seen in the data. The
data are off by roughly 1 dB in the lower portion of the band. This may be attributed to
the touchy cable being used on port 1 of the Agilent analyzer. Overall, the analyzers show
the same general measurement.

7 Conclusions
From all of the measurements taken, it can safely be concluded that the Copper Mountain
Planar 304/1 Network Analyzer is just as accurate as the current Agilent E8364B PNA Net
work Analyzer used in the lab. The Copper Mountain analyzer provides a simple, intuitive,
and smooth interface to look at measured data. The Copper Mountain analyzer even pro
vides some other built in functionality that the Agilent analyzer does not have such as the
additional RF filter statistics and the time domain analysis. Overall, the Copper Mountain
analyzer seems like a great piece of test equipment.
Related Post
Copper Mountain Technologies' Planar 808/1 Vector Network Analyzer Field-Tested at the Hamburg University of Applied Science
July 9, 2018
The Hamburg University of Applied Sciences is one of the larger technical universities in Germany. Over 1000 students study in the field of Electrical and Information Technology. In the Laboratory for Communication Technology, under the guidance of Prof. Ralf Wendel, training in the field of RF and Microwave Technology takes place. Students from the Electrical and Information Technology bachelor’s curriculum as well as the master’s program, Information and Communication Technology, participate in application of learned principles.
Getting Started with the CMT VNA: Top 10 Tips and Tricks
February 14, 2018
The examples created in this document are based on the S5048, but apply to most of the Copper Mountain Technologies VNAs in a similar way. These tips will help you use your VNA with ease and help you get more intuitive results.
A Guide to CMT VNA Software Families and VNA Series
February 14, 2018
Copper Mountain Technologies (CMT) provides a variety of Vector Network Analyzers (VNA) to accommodate a wide range of test and measurement needs. The CMT VNA family covers a wide span of frequencies starting from 20 kHz, and extending to 20 GHz, with 1-port, 2-port or 4-port configurations. 2-port VNAs are further divided into two groups: one capable of measuring 2-port 1-path measurements, and the other capable of full 2-port 2-path measurements.


Comments (2)