Time Domain Analysis with a CMT VNA
October 2, 2019INTRODUCTION
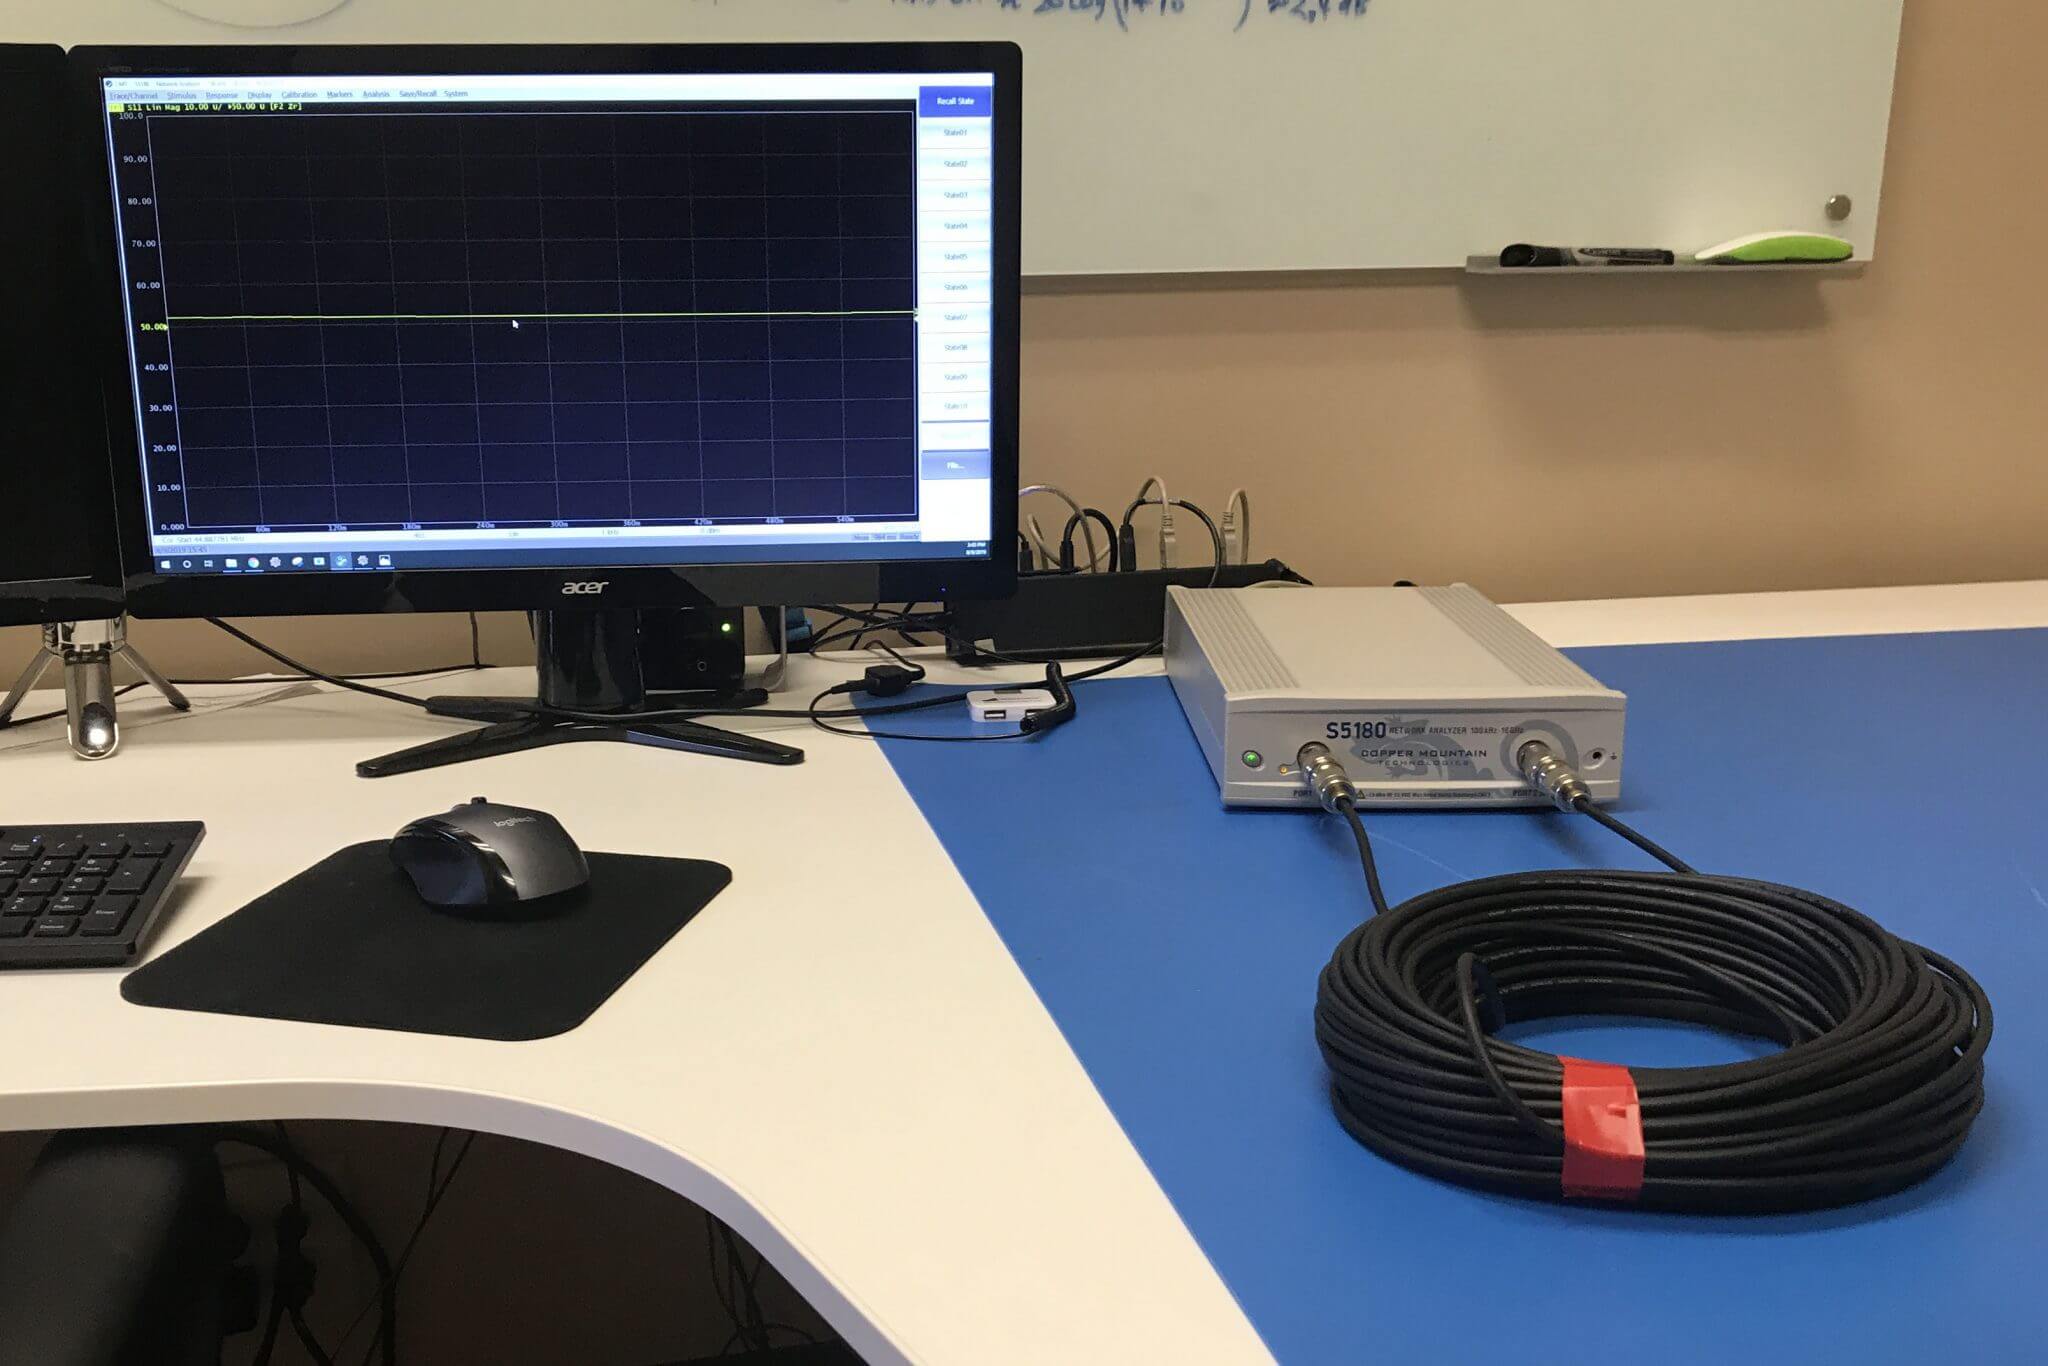
A Vector Network Analyzer (VNA) natively measures complex S-parameters of a device under test (DUT) in the frequency domain mode by sweeping across various frequency points. While there is an exhaustive list of measurements that can be accomplished in the standard frequency domain mode – using the advanced inverse Chirp z-transformation, the measurements can also be simultaneously analyzed in the time domain mode. This gives the added advantage where the two fundamental modes of analysis can be performed by one single instrument.
A VNA with its highly accurate vector error correction method can precisely locate the mismatches just like a traditional Time Domain Reflectometer (TDR) would. Although both instruments provide frequency and time domain using Fourier transform, they work differently in terms of the principle operation. Unlike a TDR where it sends a step or an impulse down the transmission line and compares the reflected signal with a wideband oscilloscope, a VNA uses narrowband tuned receivers to compare the swept frequency signal, thereby paving way to achieve better signal to noise ratio. Creating a higher dynamic range, which is useful for a lot of measurements, even in the time domain mode.
For an RF/Microwave engineer, time domain measurements are primarily useful in identifying a device’s behavior at specific locations. And more recently, with the increasing necessity of high-speed applications, VNAs are also gaining popularity with digital engineers for signal integrity tests.
Note: All Copper Mountain Technologies’ VNAs, except the compact M Series, come with time domain and gating as a standard feature in the VNA application software.
BRIEF THEORY
Fourier transform is a powerful tool which makes the frequency and time domain transformations possible. These transformations are performed by analyzing the impulse and step responses of a network. Various fast Fourier transform (FFT) algorithms are used in test and measurement instruments due to its superior computation times when compared to discrete Fourier transform (DFT). However, as the VNA measures discrete magnitude and phase of the DUT over a finite frequency range, there are some limitations on the transformations that can be applied. So, a proprietary chirp z algorithm is used. The advantage of using chirp z is that it offers greater flexibility in evaluating the z-transform along contours other than the unit circle, as the input and output samples do not have to be the same. This essentially allows the user to zoom into the desired area on the time domain axis.
From [1], for a given N-sample sequence, the chirp z-transform is defined as:

Where X(k) is the transformed response for the given N-sample sequence x[n] sampled in M points (0 ≤ k
≤ M – 1). Here A and W are arbitrary complex numbers defined as:
𝐴 = 𝐴0𝑒𝑖2𝜋𝜃0
𝑊 = 𝑊0𝑒−𝑗2𝜋𝜑0
Where 𝐴0 is the starting radius, 𝜃0 is the starting angle and 𝜑0 is the angular step size. The rate at which the contour spirals in or out from the circle of radius 𝐴0 is set by the constant 𝑊0. The 𝐴 𝑊−𝑘 term configures the contour at which the z-transform is defined.
Besides this, there are additional functions to be considered prior to applying transformation such as: low pass (where the DC and negative frequencies are extrapolated to simulate TDR) & bandpass modes (for band limited DUTs) and windowing (to truncate the signal) to name a few. Users can adjust these settings to best suit their application. As the focus of this application note is not to delve into the underlying algorithm, the next section shows how these, and other settings affect the time domain transformations in a VNA.
SETTINGS
Time domain transformations are trace wise operations performed on an active trace when the sweep type is set to linear. To accomplish the desired time domain measurements for various applications, appropriate settings must be used.
Frequency Domain Settings
Frequency Span
Resolution in time domain is inversely proportional to the frequency span of the VNA setting. So, the wider the frequency, the better the resolution is. In addition to the frequency span settings, the window settings (discussed later) also determine the resolution in time domain mode:

Where 𝑉𝑝 is the velocity factor of the transmission line

For proper time domain computations, it is always recommended to choose more than adequate frequency points. However, the downside of setting a large number of frequency points is the slower sweep speed.
Time Domain Settings
Transformation Type:
A: Bandpass Mode
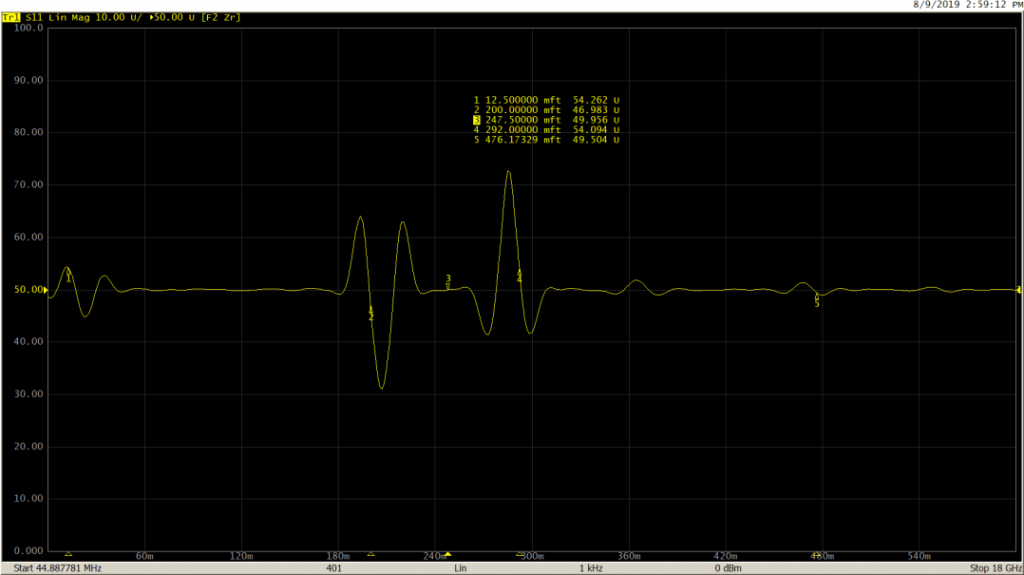
The bandpass mode is a simpler and generic transformation mode, which simulates the impulse bandpass response. This mode does not require the frequencies to be harmonically related. So, it can be used over any arbitrary frequency range. This is mostly useful for measuring band-limited devices such as filters and waveguides. The disadvantage here is that this mode only allows you to identify locations of mismatches and discontinuities, it does not show if they are capacitive, inductive, or resistive.

Here is a bandpass mode response for impedance vs. distance on a 50-25-50 Ohm line:
B: Lowpass Mode
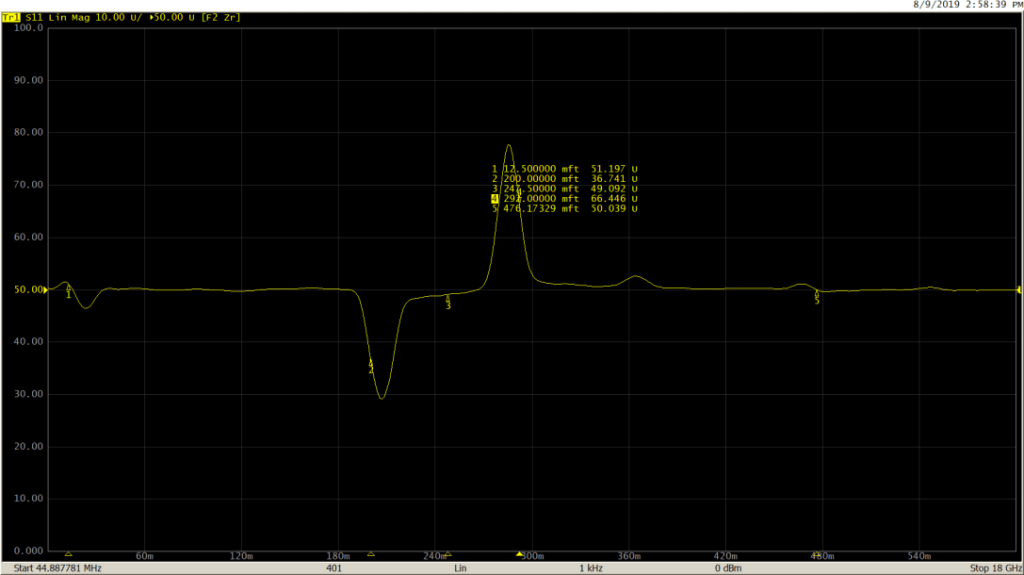
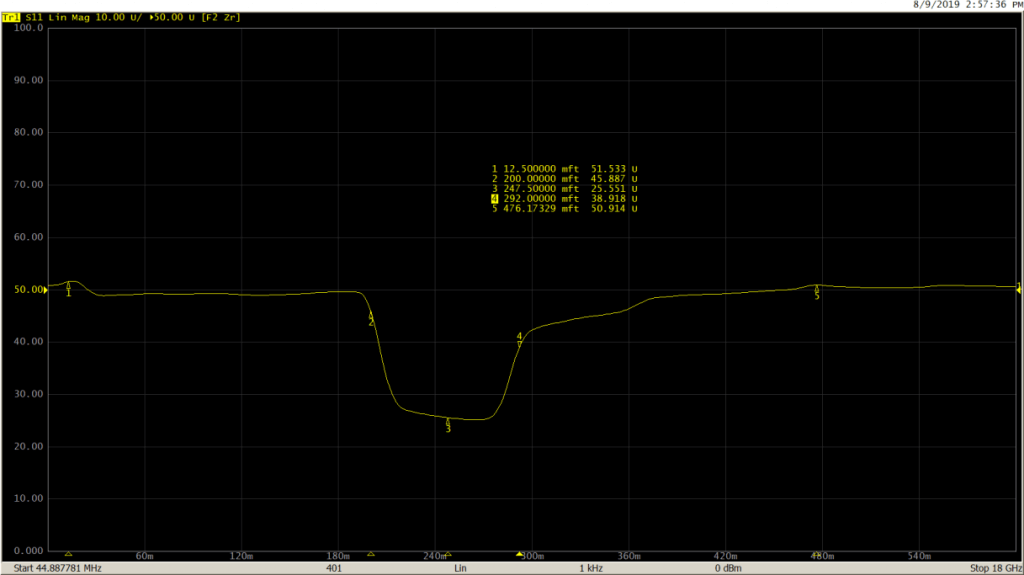
The low-pass mode, on the other hand, is useful in determining the type of impedance change present at the mismatch location. This mode simulates lowpass impulse or step responses. In both the low-pass modes, frequencies down to DC are extrapolated to create the harmonic grid necessary for this transformation. Because of this, both step and impulse low-pass modes provide better time domain resolution for a given frequency span than the bandpass mode. In this mode, response to the step and the impulse stimulus contains information describing both, where the mismatch is located, as well as what type of impedance change is present. This mode is suitable for DUTs which go down to DC, such as cables.
Measurement performed on the same DUT (50-25-50 Ohm line) using lowpass impulse mode:
And finally, with the lowpass step mode:
Windowing
In practice, every signal must be finite before processing. So, the input signal must be sampled and truncated before performing time domain transformations. However, this results in spectral leakage at discontinuities. The amount of this leakage is dependent on the amplitude of the discontinuities; which can be adjusted by applying the window function. This is performed by multiplying the time domain signal with a window waveform.
The VNA application uses Kaiser window to perform time domain transformation. The Kaiser window is described by β parameter, which smoothly fine-tunes the window shape from minimum (rectangular) to maximum. The window shape can be fine-tuned or set using the three preprogrammed windows:
- Minimum (rectangular)
- Normal
- Maximum
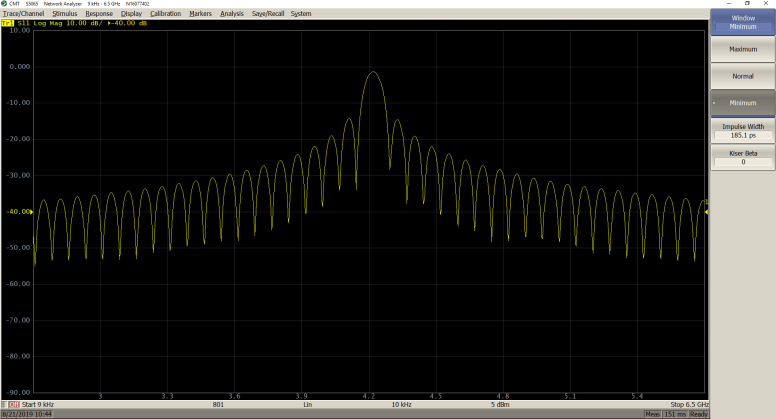
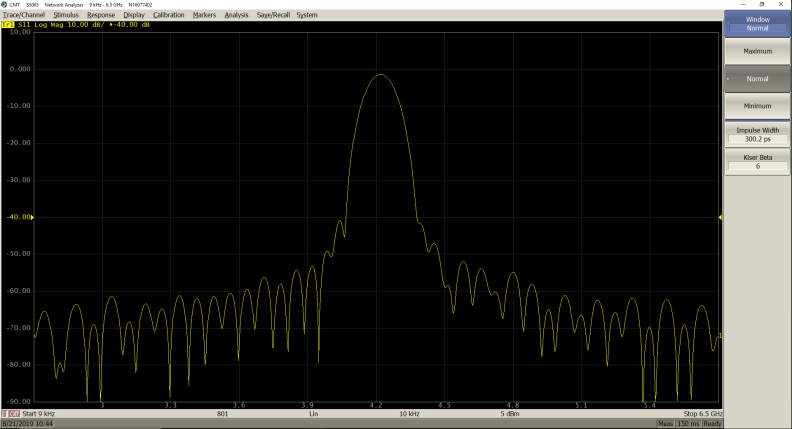
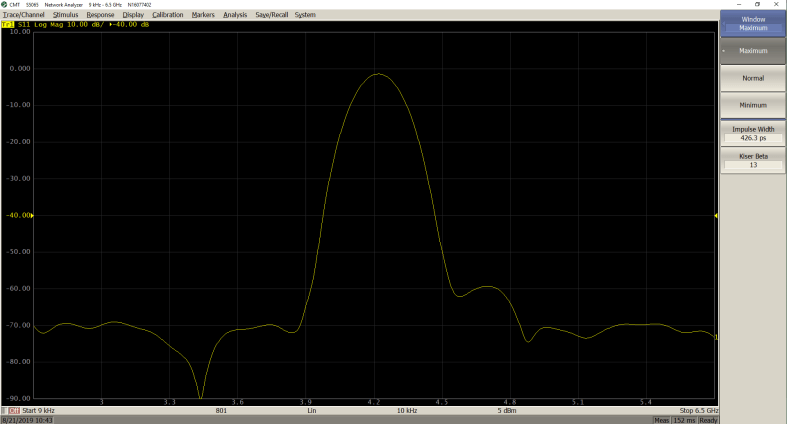
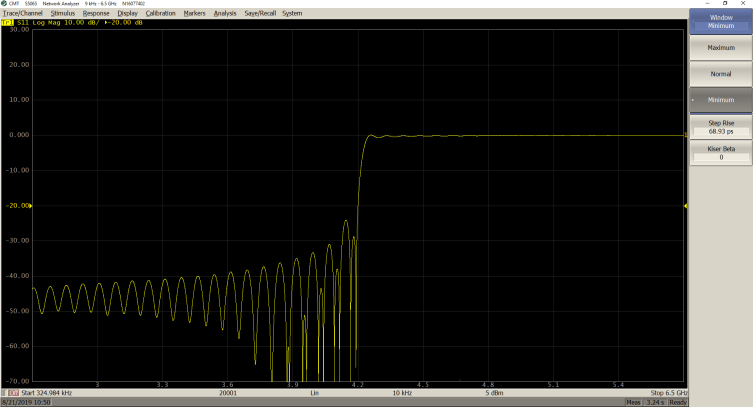
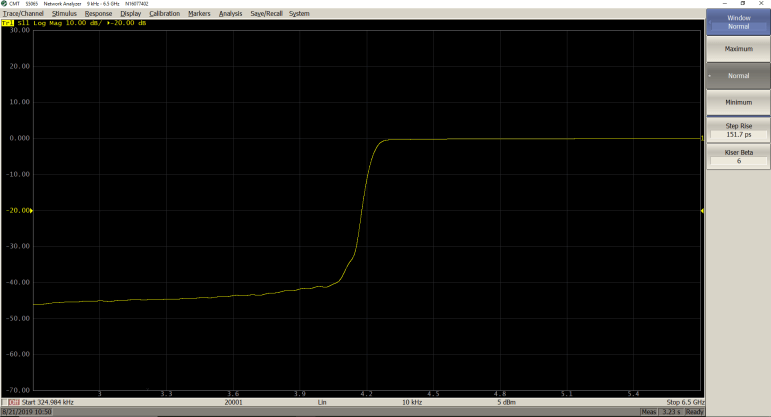
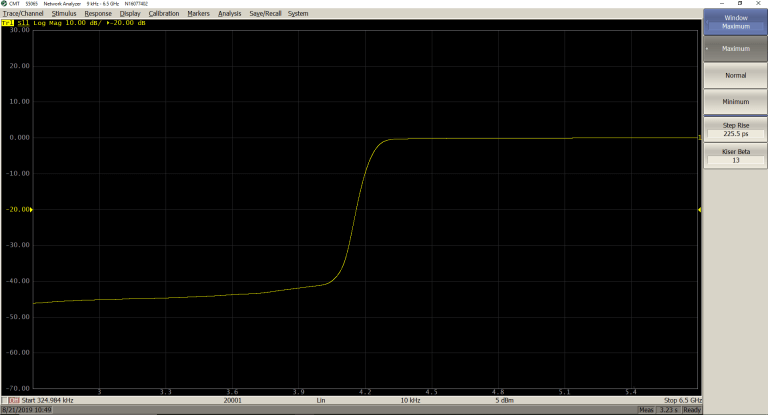
The β values can be adjusted from 0 to 13. 0 corresponds to minimum window, 6 corresponds to normal window, 13 corresponds to maximum window. As the β value increases, it is easy to notice the trade-off between the main-lobe width (or the step rise time in low pass) and the side-lobe level.
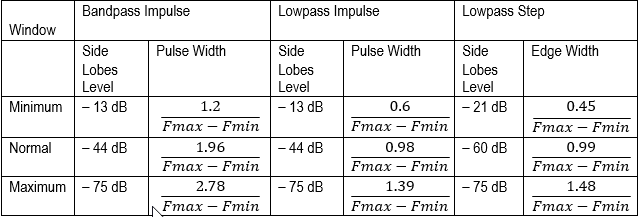
Here are the effects of windowing:
Bandpass Mode:
Minimum (β = 0; Impulse Width = 185.1 ps)
Normal (β = 6; Impulse Width = 300.2 ps)
Maximum (β = 13; Impulse Width = 426.3 ps)
Lowpass step Mode
Minimum (β = 0; Step Rise = 68.93 ps)
Normal (β = 6; Step Rise = 151.7 ps)
Maximum (β = 13; Step Rise = 225.5 ps)
Velocity Factor
Time and distance are related by velocity. To obtain the accurate mismatch location, it is important to set the right velocity factor of the transmission medium.
By default, the application software assumes it to be equal to 1. But in practice, this can be different depending on the characteristics of the transmission line. If the velocity factor of a transmission line is not known, it can be calculated from the dielectric constant value:
The two measurements below show the impact of entering the proper velocity factor value on a 100 feet cable:
𝑉𝑓 = 1
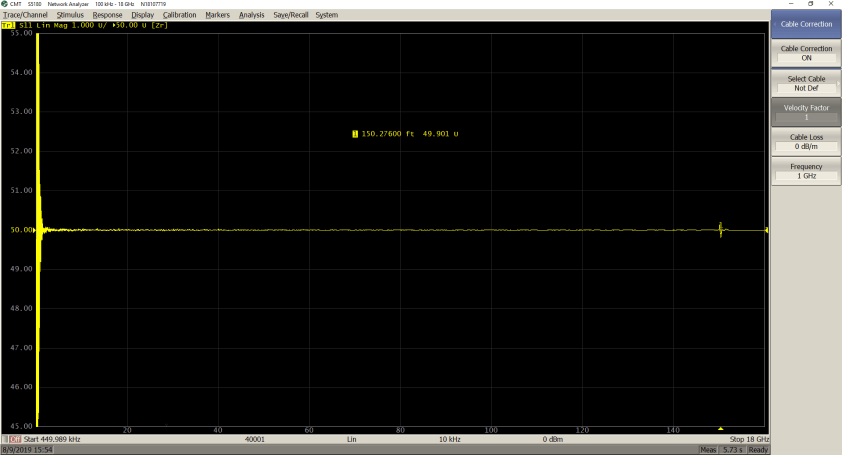
𝑉𝑓 = 0.66
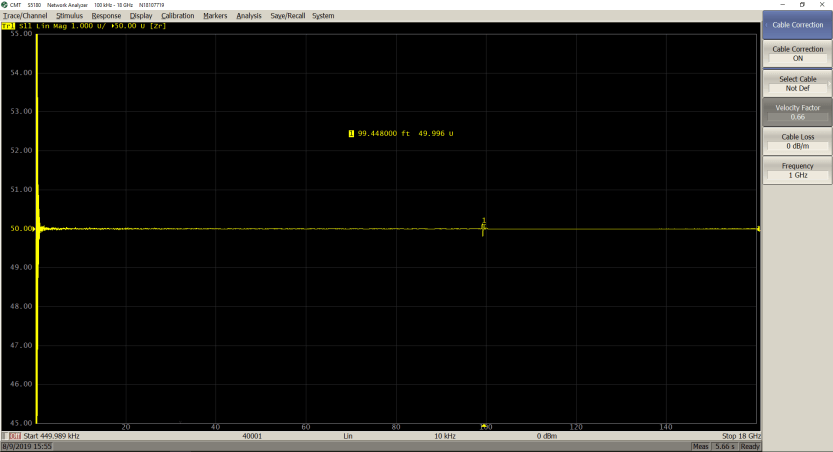
As seen from the marker values, only by entering the proper velocity factor (0.66 for the cable under test), can the correct length of the cable be seen.
TIME DOMAIN GATING
Time domain gating is another powerful feature in a VNA which mathematically removes the unwanted responses in time domain. The function performs time domain transformation and applies reverse transformation back to frequency domain to the user-defined span in time domain. This function is used to remove the mismatch effects of the fixture devices from the frequency response, if the useful signal and the mismatch signal are separable in time domain.
The function involves two types of time domain gating:
- bandpass – removes the response outside the gate span,
- notch – removes the response inside the gate
The rectangular window shape in frequency domain leads to spurious sidelobes, due to sharp signal changes at the limits of the window. The following gate shapes are offered to reduce the sidelobes:
- maximum;
- wide;
- normal;
- minimum;
The minimum window has the shape close to rectangular. The maximum window has a more smoothed shape. From minimum to maximum window shape, the sidelobe level increases and the gate resolution reduces. The choice of the window shape is always a trade-off between the gate resolution and the level of spurious sidelobes.
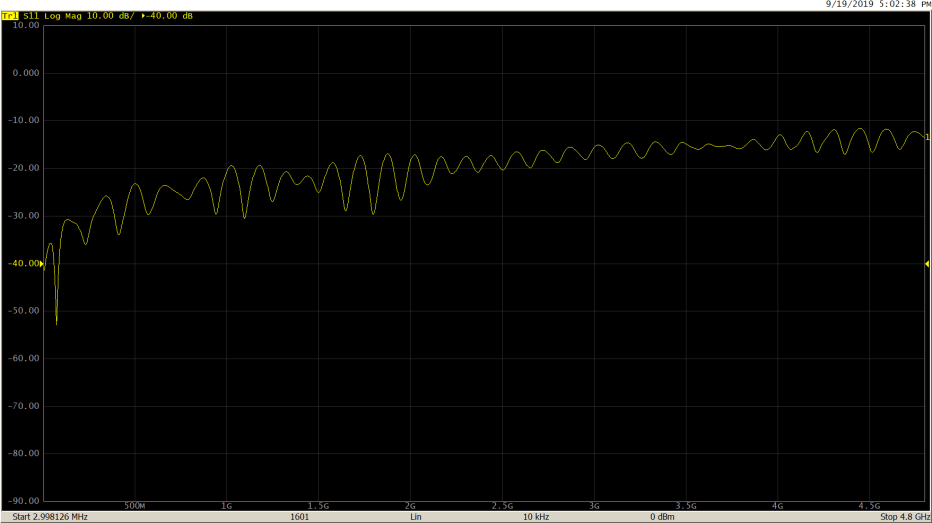
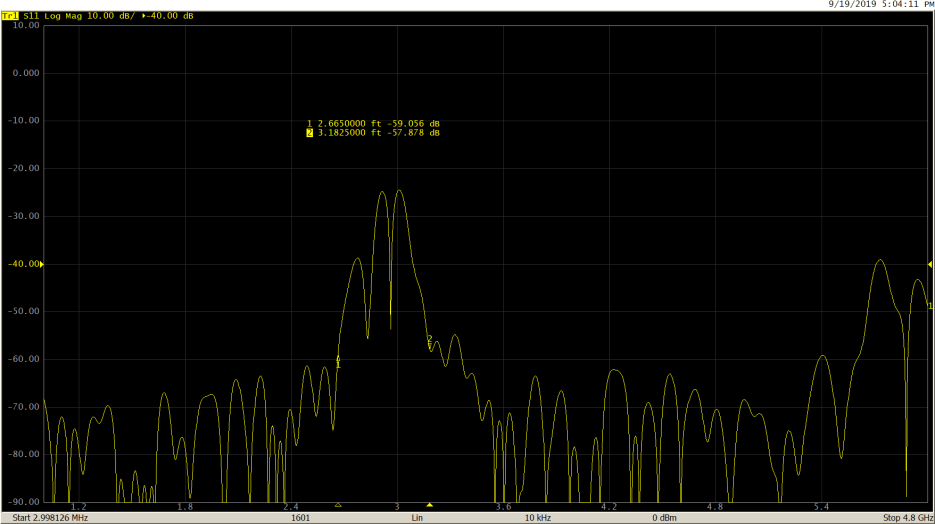
Here is the effect of applying gating on a mismatch in a 50 Ohm cable:
S11 return loss in frequency domain before applying gating:
Response viewed in time domain:
S11 return loss in frequency domain after gating:
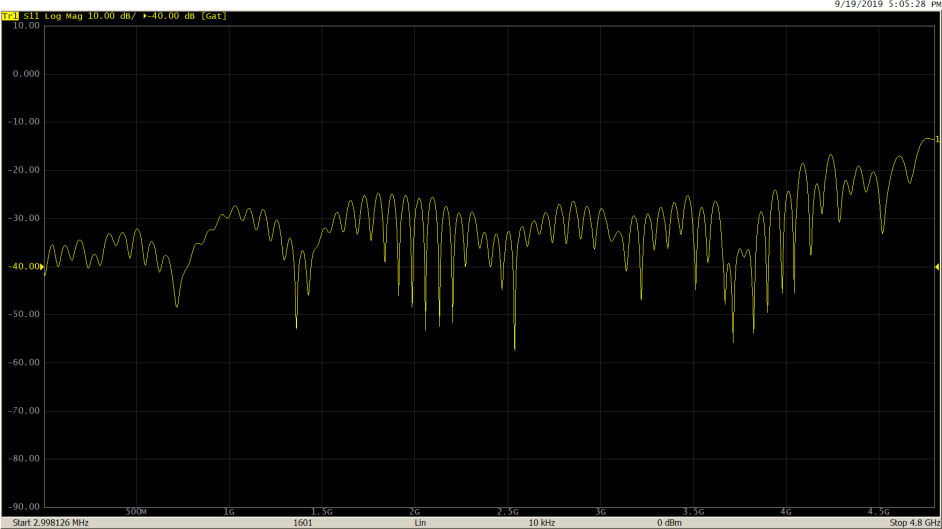
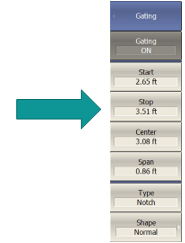
After gating out the mismatch using ‘Notch’ type, as expected, the S11 return loss shows improvement.
ACCURACY CONSIDERATIONS
Due to the intricacies involved in setting up time domain measurements for various applications, the measurement accuracy of a vector network analyzer (VNA) in time domain is not specified. Therefore, these data are not stated in the specifications, since they depend not only on the parameters of the VNA in the frequency domain, but also on the properties and configuration of the device under test (DUT) in the time domain.
Measurement of delay (or distance) primarily depends on two factors:
First, the frequency span or the maximum frequency of the VNA determines the resolution in time domain (inversely proportional as mentioned above in the ‘Calculator’ section). Based on the transformation setting, the maximum error can be equal to half the resolution:

Secondly, when the delay is recalculated into distance considering the value of the effective permittivity of the medium. The error in known permittivity increases the error in calculating the distance.
COMMON APPLICATIONS
A: Impedance on a PCB line
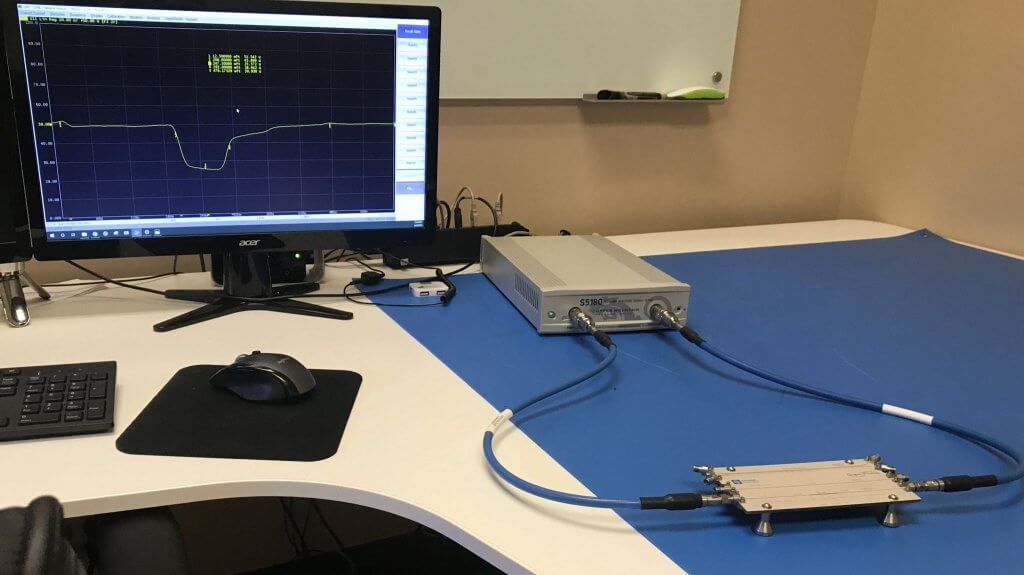
Setup
S5180 VNA (2-port, 100 kHz to 18 GHz), two N-type to 3.5 mm adapters, two 2.92 mm coaxial cables and a sample board with a 25 Ohm Beatty line.
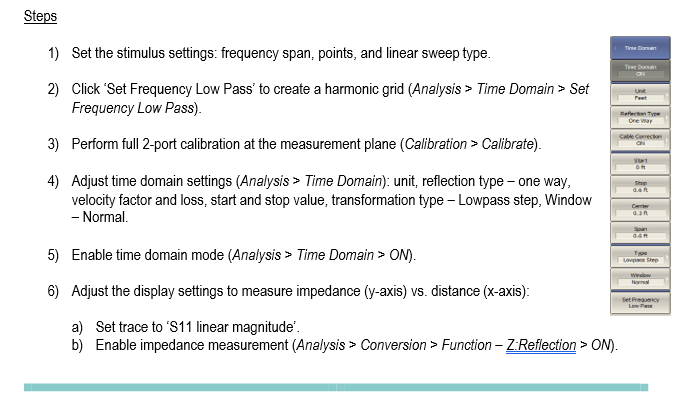
Measurement
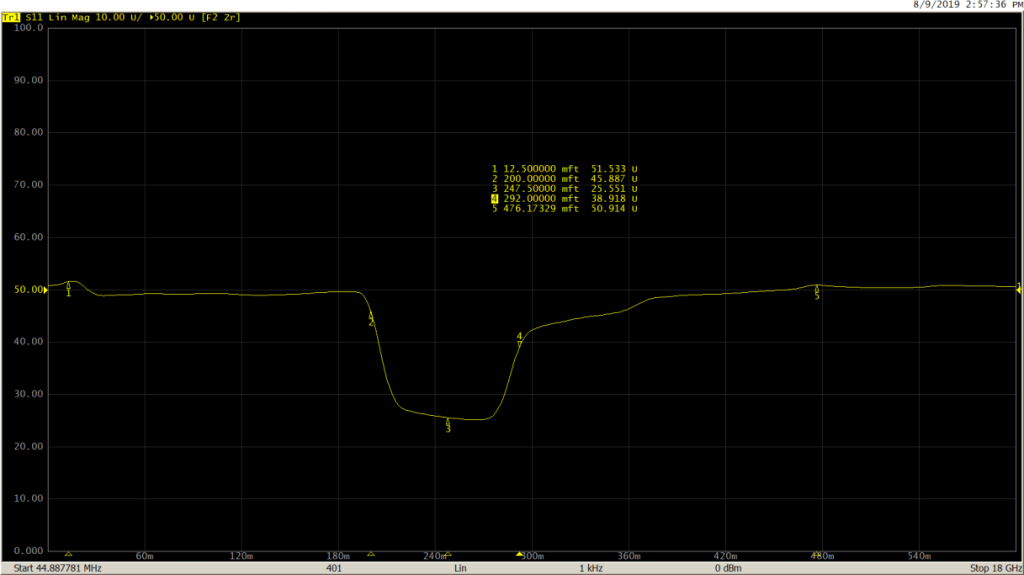
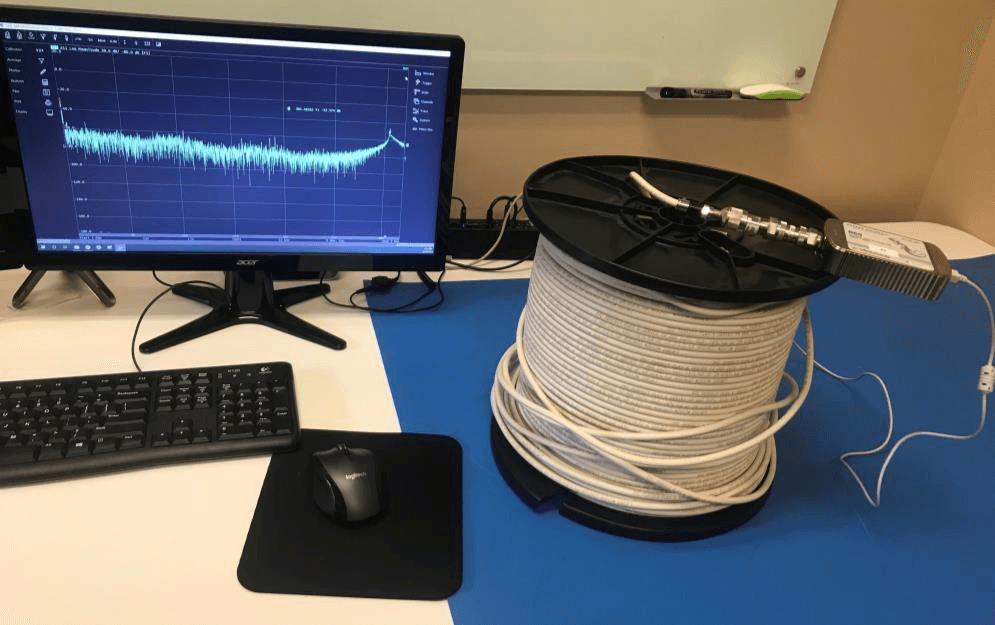
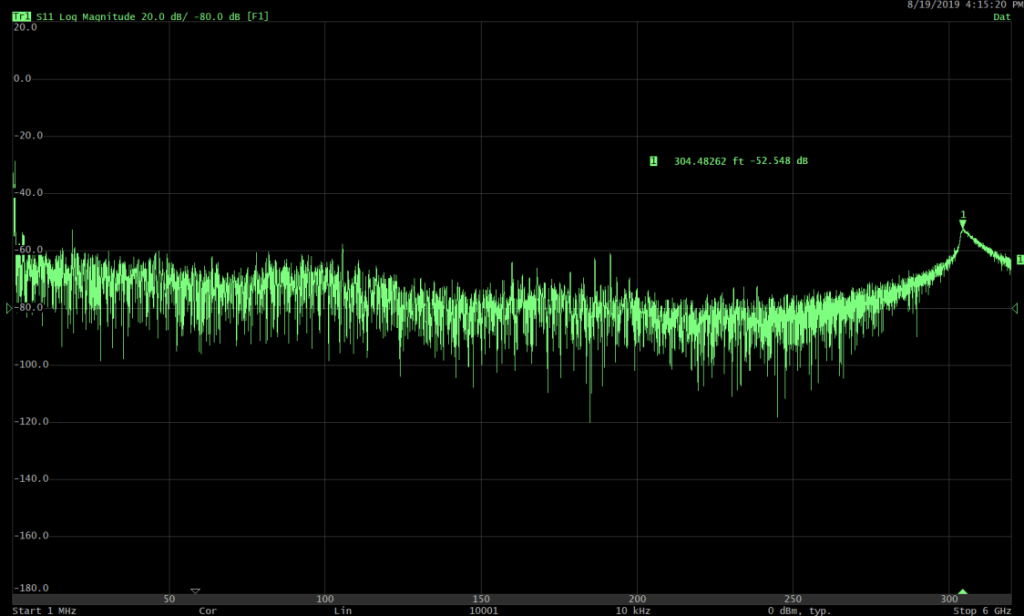
B: DTF on a long cable
Setup
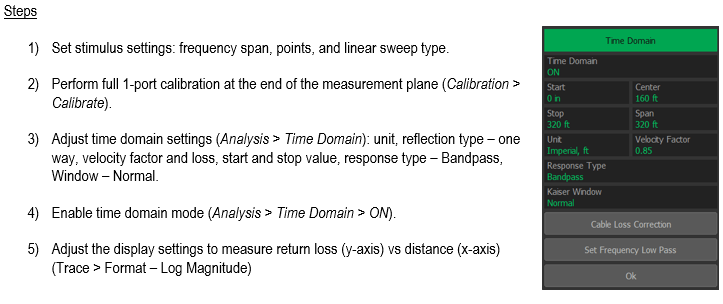
R60 VNA (1-port, 1 MHz to 6 GHz), one N-type 50 Ohm barrel, one N-type 50 Ohm to 75 Ohm adapter, one N-type to F-type adapter, one 300-foot-long CATV cable under test.
Measurement
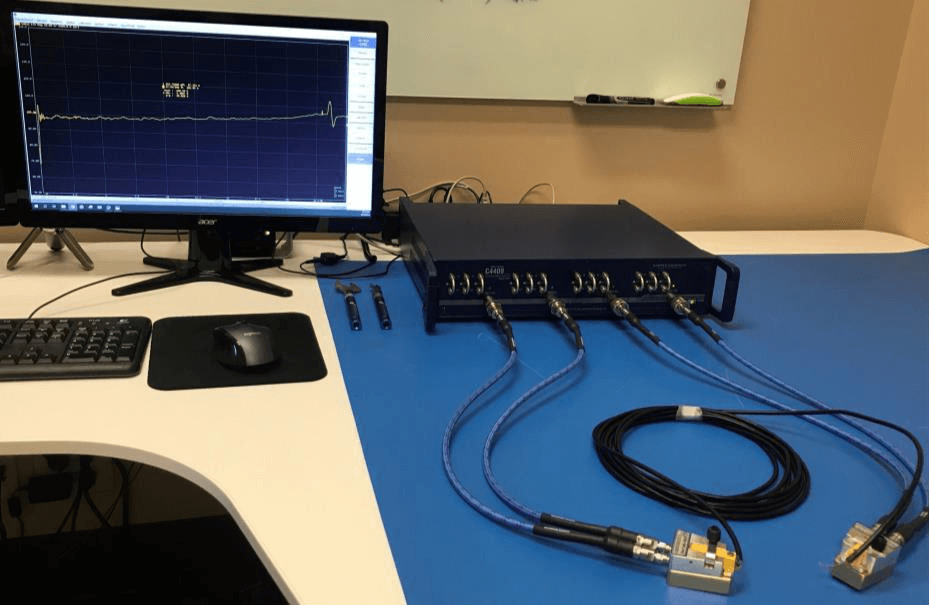
C: High speed differential measurements
Setup
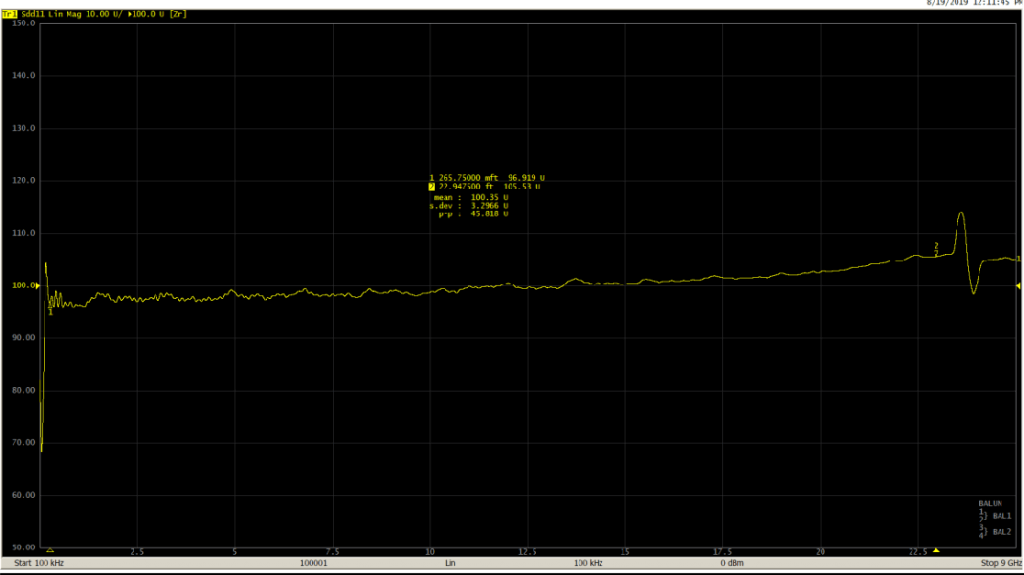
C4409 VNA (4-port, 100 kHz to 9 GHz), four N-type to 3.5 mm adapters, four 2.92 mm coaxial cables, two coaxial to raw cable fixtures and a 100 Ohm differential high speed LVDS cable under test.
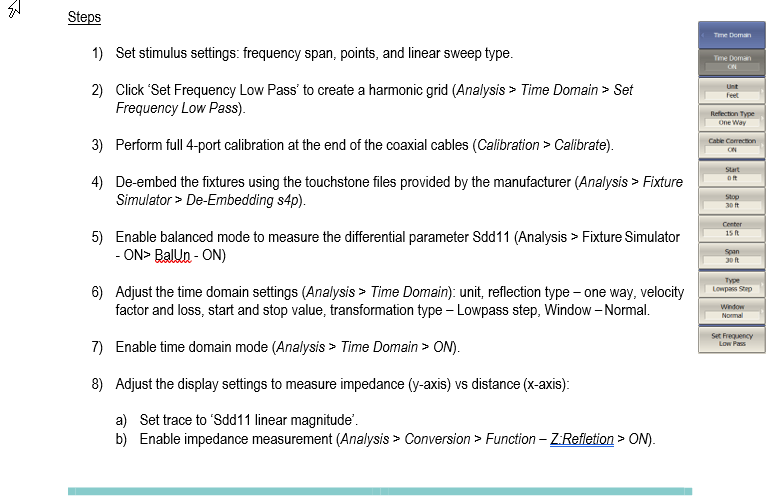
Measurement
D: X-band horn antenna
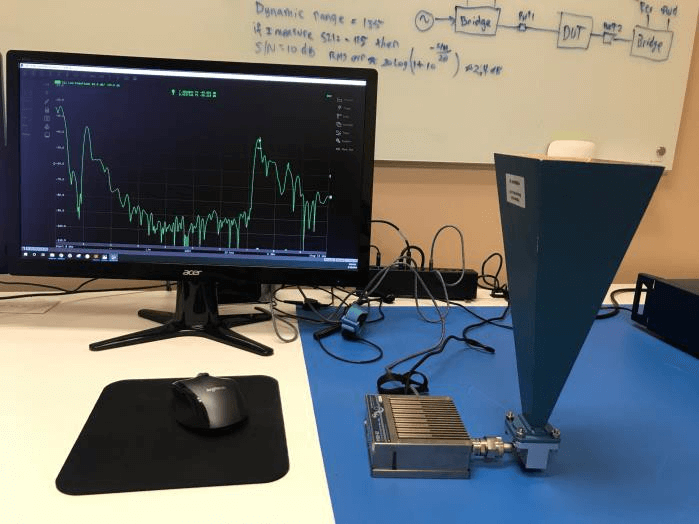
Setup
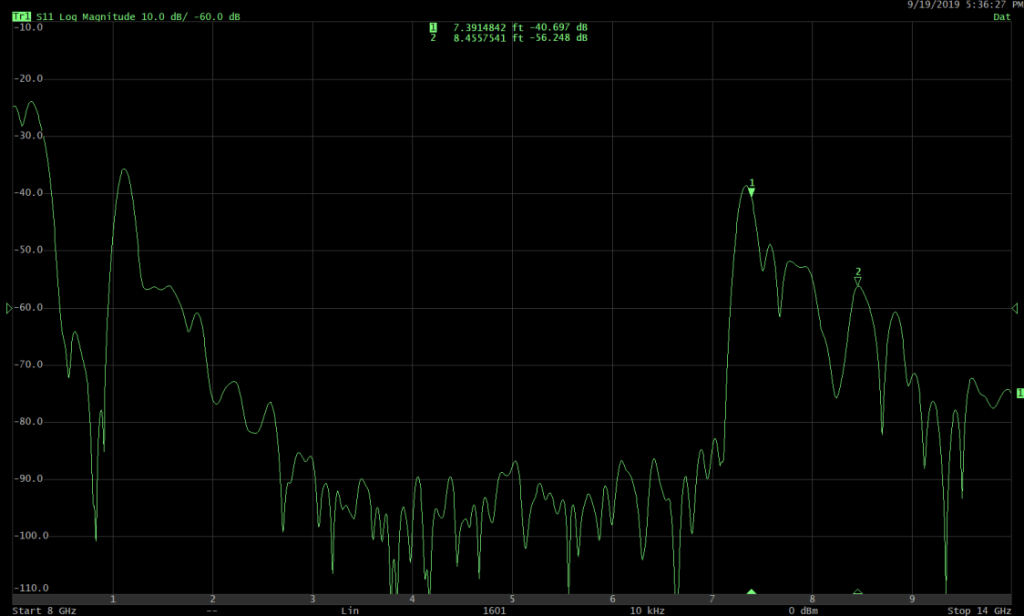
R180 VNA (1-port, 1 MHz to 18 GHz) and X-band antenna
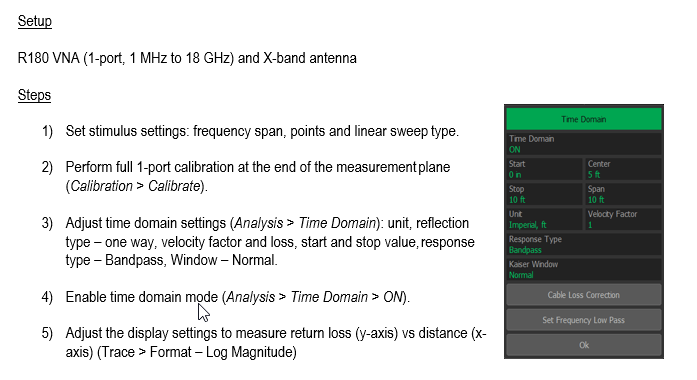
Measurement
CONCLUSION
As a VNA measures both the magnitude and the phase of the DUT in frequency domain, we have seen that using the built-in inverse Fourier transformation algorithm measurements could be viewed in the time domain mode as well. We have seen how different settings can impact the time domain transformation, and the various applications that could be performed using this feature.
If you need further information on this application note or any assistance with your application, please contact: [email protected].
REFERENCES
- “The Chirp z-Transform Algorithm”, R. Rabiner, R. W. Shafer, C. M. Rader
- “S2VNA Operating Manual” http://3.141.29.121/s2-operating-manual/
- “Time Domain Reflectometry Measurements with a Vector Network Analyzer” video http://3.141.29.121/video-time-domain-reflectometry-measurements-with-a-vector- network-analyzer/, Brian Walker
- “Sparse Inverse Chirp-Z Transform of S-Parameter Measurements for Time Domain Analysis of Transmission Line”, Guilherme H. Weber, Hector L. Moura, Guilherme Dutra, Uilian J. Dreyer, Rafael J. Daciuk, Jean C. C. da Silva, Cicero Martelli, Daniel R. Pipa, Marco J. da
- “Time-Domain Reflectometry using S-Parameters and De-embedding Application”, S. Ali and R. Mittra
- “Fundamentals of Vector Network Analysis”, Michael Hiebel
Related Post

Time Domain Analysis with a CMT VNA
October 2, 2019
A Vector Network Analyzer (VNA) natively measures complex S-parameters of a device under test (DUT) in the frequency domain mode by sweeping across various frequency points. While there is an exhaustive list of measurements that can be accomplished in the standard frequency domain mode – using the advanced inverse Chirp z-transformation, the measurements can also be simultaneously analyzed in the time domain mode. This gives the added advantage where the two fundamental modes of analysis can be performed by one single instrument.

Design Trends in Automotive Electronics and Radar Sensors eBook from Microwave Journal
June 17, 2019
Automotive electronics is experiencing a big boost from the trends toward more connectivity, autonomy and electrification. These trends started years ago with the addition of satellite radio and GPS but is quickly increasing with cellular connectivity, ADAS and autonomy being incorporated into more vehicles. Yole Development predicts a 23% CAGR from 2016-2022 for mmWave radar sensors growing to $7.5 B at the module level. The global automotive electronics market is predicted to grow from its current value of $270B to more than $400B by 2024 according to Global Market Insights, Inc. The development of intelligent vehicle technologies owing to the need for advanced safety and comfort parameters will drive the market growth according to the company.
Calibration Types and Considerations
April 19, 2018
One of the most frequently asked questions we receive at Copper Mountain Technologies’ sales and support departments goes something like this: “What about calibration?” It’s an unfortunate reality that in the English language, Calibration has two completely distinct definitions. The first relates to checking out the instrument periodically to make sure it is operating within its specifications. “Performance test” is the procedure by which the analyzer performance is verified, typically annually. The second meaning is to do with Measurement or User calibration, a collection of techniques by which measurement accuracy is maximized and made to exclude elements of the system from those measurements (such as cables, adapters and the like). In this application note, we discuss both meanings of calibration as related to Copper Mountain Technologies’ Vector Network Analyzers (VNAs). First, we describe Annual Calibration and then later we discuss measurement calibration.

Why USB VNAs?
February 14, 2018
USB VNAs separate the measurement module from the processing module, bringing the measurement results to any external PC using the VNA software. The user can take advantage of the latest OS processing power, bigger display, and more reliable performance of an external PC while simplifying maintenance of the analyzer. USB VNAs are flexible. They can be easily adapted to multiple users and are well-suited for lab, production, field, and secure testing environments.


Comments (31)